


How to Evaluate a Stock: 4 Financial Metrics That Really Matter
A rising stock price can make a company look like a great investment. But does a higher price necessarily mean a stronger business?
Not always.
Stock prices reflect market expectations, investor sentiment, economic conditions, and assumptions about future performance. Those expectations can change quickly, even when the underlying business has barely changed.
That’s why evaluating a stock requires looking beyond its price chart.
A more structured approach starts with understanding how a company grows, generates profits, converts those profits into cash, and distributes value among shareholders.
Four financial metrics can help investors build that understanding:
- Revenue growth: Is the business expanding sustainably?
- Operating margin: How efficiently does the company convert sales into operating profit?
- Free cash flow: How much cash does the business generate after capital expenditures?
- Shares outstanding: How does the company’s share count affect existing shareholders?
Together, these indicators provide a foundation for evaluating a company’s financial health and developing a more informed investment thesis.
1. Revenue Growth: Is the Business Growing for the Right Reasons?
Revenue represents the money a company generates from selling its products or services before accounting for expenses.
Growing revenue can indicate increasing demand, successful product development, geographic expansion, or a stronger competitive position.
But not all revenue growth creates the same value.
Imagine two companies reporting 15% annual revenue growth.
Company A achieves that growth by attracting new customers, retaining existing ones, and increasing sales of its core products.
Company B achieves the same growth primarily through acquisitions funded by debt and aggressive discounts that reduce profitability.
Both companies report identical revenue growth, but their underlying business performance may be very different.
What should investors examine?
Organic growth
Is the company growing through its existing operations, or primarily through acquisitions?
Revenue quality
Does growth come from recurring customer relationships, sustainable demand, or temporary promotions?
Growth sustainability
Can the company maintain its expansion without sacrificing profitability or relying excessively on external financing?
Industry context
A 5% revenue growth rate may be attractive for a mature business, while the same rate could signal slowing momentum for a company operating in a rapidly expanding market.
The key takeaway
Revenue growth matters, but understanding how a company grows is just as important as measuring how much it grows.
Sustainable expansion supported by genuine demand is generally a stronger foundation for long-term value creation than growth that depends on temporary incentives or increasingly expensive acquisitions.
2. Operating Margin: How Much Profit Does the Business Keep?
Revenue growth tells investors how much a company sells.
Operating margin helps explain how much operating profit remains after the costs of running the business.
It measures the percentage of revenue converted into operating income.
Operating Margin = Operating Income ÷ Revenue × 100
Consider a simplified example.
Two companies generate $10 billion in annual revenue.
| Financial Metric | Company A | Company B |
|---|---|---|
| Revenue | $10 billion | $10 billion |
| Operating Margin | 10% | 30% |
| Operating Income | $1 billion | $3 billion |
Despite generating identical revenue, Company B produces three times as much operating income.
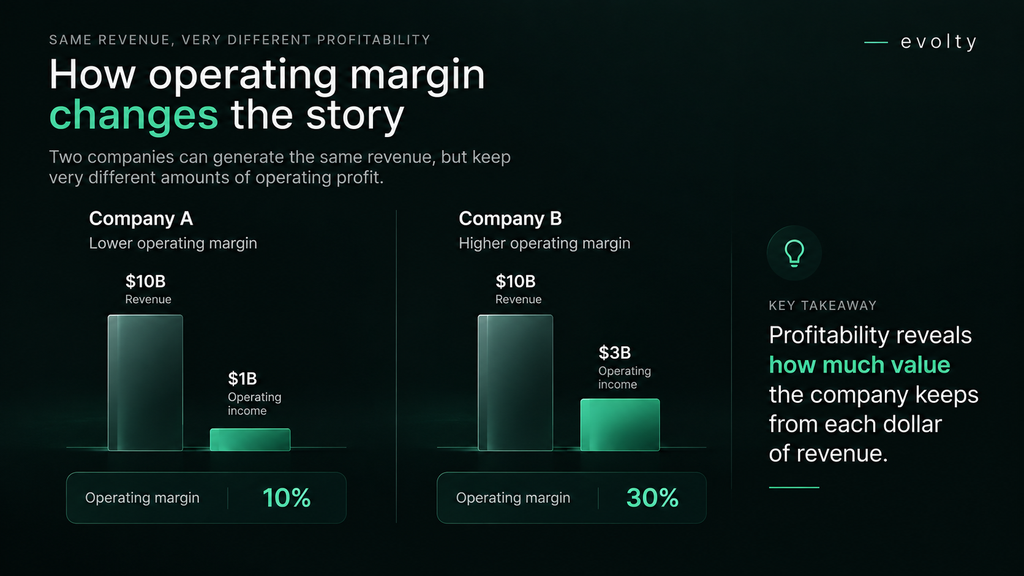
That difference can have significant implications for cash generation, reinvestment capacity, and valuation.
Why are operating margins important?
Consistently strong margins can indicate operational efficiency, competitive differentiation, economies of scale, or pricing power.
For example, a business with a differentiated product may be able to increase prices without losing many customers.
A company facing intense competition may have less flexibility, forcing it to absorb higher operating costs or reduce its prices.
However, a high operating margin doesn’t automatically make a company a better investment.
Different industries have different cost structures. Software companies, retailers, industrial manufacturers, and healthcare businesses may operate with substantially different margin profiles.
What should investors look for?
- Are operating margins improving, stable, or declining?
- How do the company’s margins compare with relevant competitors?
- Are margin improvements driven by sustainable efficiency gains or temporary cost reductions?
- Does the company have pricing power that can help protect profitability?
The key takeaway
A growing business becomes more attractive when revenue expansion is accompanied by healthy, sustainable profitability.
Operating margins help reveal whether a company is translating commercial success into meaningful operating results.
3. Free Cash Flow: Is the Company Generating Real Cash?
A company can report accounting profits without generating an equivalent amount of cash.
This difference matters because businesses need cash to fund operations, invest in future growth, repay debt, and potentially return capital to shareholders.
Free cash flow (FCF) measures the cash generated by a company’s operations after subtracting capital expenditures.
Free Cash Flow = Operating Cash Flow − Capital Expenditures
Capital expenditures include investments in assets such as equipment, infrastructure, and technology.
Free cash flow provides another perspective on financial performance beyond the income statement.
An example: Profits are rising, but cash flow is falling
Imagine a company reporting steadily increasing net income.
At first glance, its financial performance appears healthy.
But over several reporting periods, its free cash flow begins to decline.
Why might this happen?
The company could be:
- Investing heavily in new factories or infrastructure.
- Experiencing slower customer payments.
- Accumulating inventory that has not yet been sold.
- Facing increasing working capital requirements.
These factors can cause cash flow to diverge from reported earnings.
Importantly, declining free cash flow isn’t always a negative signal. A company investing heavily in profitable future growth may experience temporarily lower cash generation.
The challenge is distinguishing productive investment from deteriorating operating performance.
What should investors examine?
Cash conversion
How effectively does the company convert reported earnings into operating cash flow?
Consistency
Does the business generate positive free cash flow across different economic environments?
Capital intensity
How much does the company need to reinvest simply to maintain its competitive position?
Cash allocation
Is available cash being used for productive investments, debt reduction, dividends, or share repurchases?
The key takeaway
Free cash flow helps investors assess the financial resources a business generates and how much flexibility management has to allocate capital.
It should be examined alongside profitability, growth, and the company’s investment requirements.
4. Shares Outstanding: Are You Keeping Your Share of the Business?
When you purchase stock, you acquire an ownership interest in a company.
But your percentage of ownership can change over time.
Shares outstanding represent the number of company shares held by investors.
When a business issues additional shares, existing shareholders may experience share dilution: their ownership percentage decreases unless they purchase additional shares.
How dilution affects earnings per share
Consider two simplified scenarios.
In both cases, a company’s annual net income increases by 10%.
| Financial Metric | Scenario A | Scenario B |
|---|---|---|
| Net Income Growth | +10% | +10% |
| Share Count Growth | 0% | +8% |
| Earnings Per Share Growth | +10% | Approximately +1.9% |
In Scenario A, the company increases its earnings without issuing additional shares. As a result, earnings per share increase by 10%.
In Scenario B, the company generates the same earnings growth but increases its share count by 8%.
Because those earnings are now distributed across more shares, earnings per share increase by only approximately 1.9%.
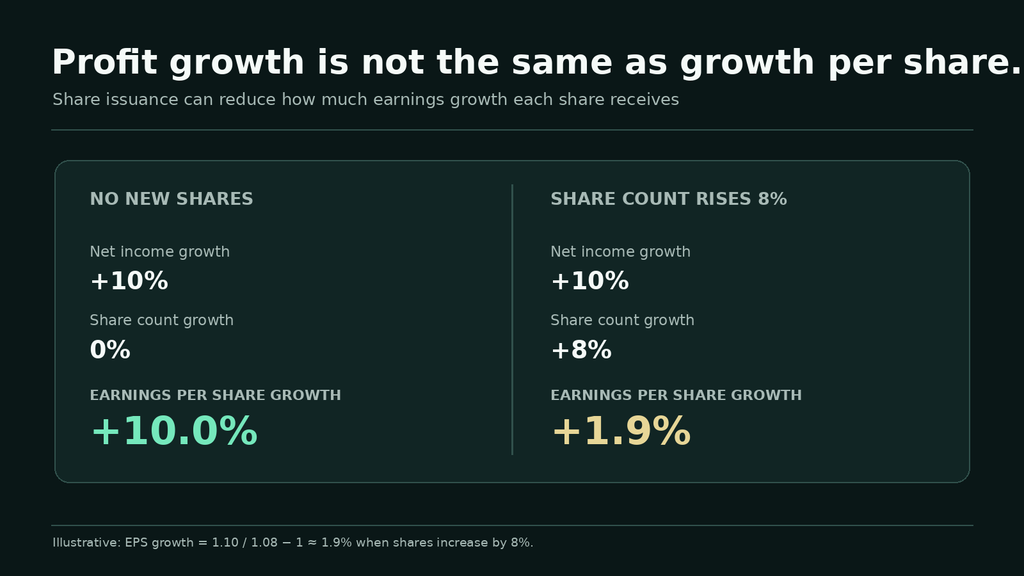
The business is growing, but the growth attributable to each share is considerably smaller.
Why do companies issue additional shares?
Share issuance can finance acquisitions, raise capital, fund expansion, or compensate employees.
Issuing shares isn’t necessarily a poor decision.
If the capital raised creates sufficient additional long-term value, the investment may ultimately benefit shareholders.
The important question is whether the value created justifies the dilution.
Companies may also repurchase shares, reducing the number outstanding. This can increase each remaining share’s proportional interest in the business, although the economic benefit depends partly on the price paid for those repurchases.
What should investors examine?
- Is the share count increasing or decreasing over time?
- Is dilution primarily associated with employee compensation, acquisitions, or external financing?
- Does the company generate sufficient cash to support its operating needs?
- Are management’s capital allocation decisions creating value per share?
The key takeaway
Business growth and shareholder value creation are related, but they aren’t identical.
Investors should evaluate not only whether a company is becoming more profitable, but also how that profitability translates into value per share.
5. Putting the Four Metrics Together
Each financial metric reveals one part of a company’s financial position.
The real insight comes from understanding how they interact.
Consider a hypothetical business with the following characteristics:
| Metric | Observation |
|---|---|
| Revenue Growth | Increasing steadily |
| Operating Margin | Expanding |
| Free Cash Flow | Growing consistently |
| Shares Outstanding | Stable |
This combination may indicate a company that is expanding, improving profitability, generating cash, and limiting dilution.
Now consider a different business:
| Metric | Observation |
|---|---|
| Revenue Growth | Increasing |
| Operating Margin | Declining |
| Free Cash Flow | Deteriorating |
| Shares Outstanding | Rising rapidly |
Although the second company’s revenue is growing, declining profitability, weaker cash generation, and increasing dilution may raise questions about the quality of that growth.
Neither profile provides a complete investment conclusion on its own.
Investors must also consider valuation, competitive advantages, financial leverage, industry dynamics, and the expectations already reflected in the stock price.
A strong company is not automatically an attractive investment at every price.
This is where a structured investment thesis becomes valuable.
6. From Financial Metrics to an Investment Thesis
An investment thesis is a structured explanation of why a stock may offer an attractive investment opportunity, what must happen for that expectation to materialize, and what could invalidate the original reasoning.
Rather than relying on a single prediction, investors can evaluate multiple possible outcomes.
Bull Case: What Could Go Right?
In an optimistic scenario, the company may outperform expectations through stronger revenue growth, improving operating margins, increasing free cash flow, or successful new product launches.
Investors might also assign a higher valuation if the company’s long-term prospects improve.
The bull case helps identify the conditions that could create additional upside.
Base Case: What Happens if Expectations Are Met?
The base case represents a reasonable central scenario based on current information and assumptions.
Revenue growth may remain sustainable, operating margins may stabilize, and free cash flow may expand in line with the company’s expected development.
This scenario provides a reference point for evaluating whether the business is performing as anticipated.
It is not necessarily the most probable outcome unless supporting evidence and probability estimates justify that conclusion.
Bear Case: What Could Go Wrong?
The bear case explores potential downside risks.
These might include slowing demand, increased competition, declining margins, weaker cash generation, or additional shareholder dilution.
By examining adverse conditions in advance, investors can better understand the risks associated with their assumptions.
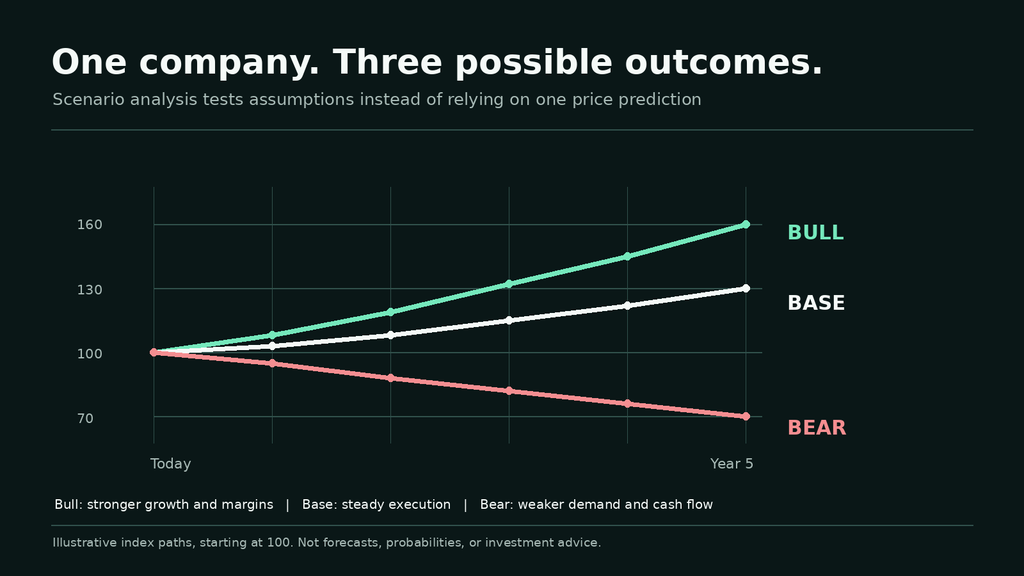
Why scenarios matter
No investor can consistently predict a company’s future with certainty.
Scenario analysis replaces a single fixed expectation with a range of possible outcomes.
It also encourages a critical question:
What would have to change for my investment thesis to be wrong?
7. When Should You Reevaluate an Investment Thesis?
Financial analysis doesn’t end when you purchase a stock.
Over time, new earnings reports, competitive developments, management decisions, and changes in economic conditions can strengthen or weaken your original assumptions.
An investment thesis should evolve as new evidence becomes available.
Potential warning signs include:
- Revenue growth slowing persistently without a convincing explanation.
- Operating margins deteriorating relative to historical performance and relevant competitors.
- Free cash flow weakening without a clear connection to productive investment.
- Share dilution increasing faster than the company’s ability to generate value per share.
A single disappointing quarter does not necessarily invalidate a long-term investment thesis.
The important distinction is between temporary volatility and a fundamental change in the business.
Investors should also revisit valuation. Even when the underlying company performs well, a stock’s potential return can change significantly as its market price changes.
A structured process helps investors evaluate these developments without relying exclusively on short-term market movements.
8. Go Beyond the Stock Price With Evolty
Understanding financial metrics is the beginning.
The next step is connecting those numbers to a company’s valuation, competitive position, risks, and possible future outcomes.
That’s the idea behind Evolty Stock.
Evolty brings several dimensions of stock research together in one place, helping you explore U.S. stocks through a more structured analytical perspective.
With Evolty, you can explore:
Investment Thesis
Understand the central reasoning behind a stock’s valuation and the conditions that support or challenge it.
Valuation & Market Expectations
Explore what current market prices may imply about a company’s future performance.
Bull, Base & Bear Scenarios
Compare different possible outcomes and their associated assumptions.
Catalysts & Risks
Identify developments that could improve or weaken a company’s investment outlook.
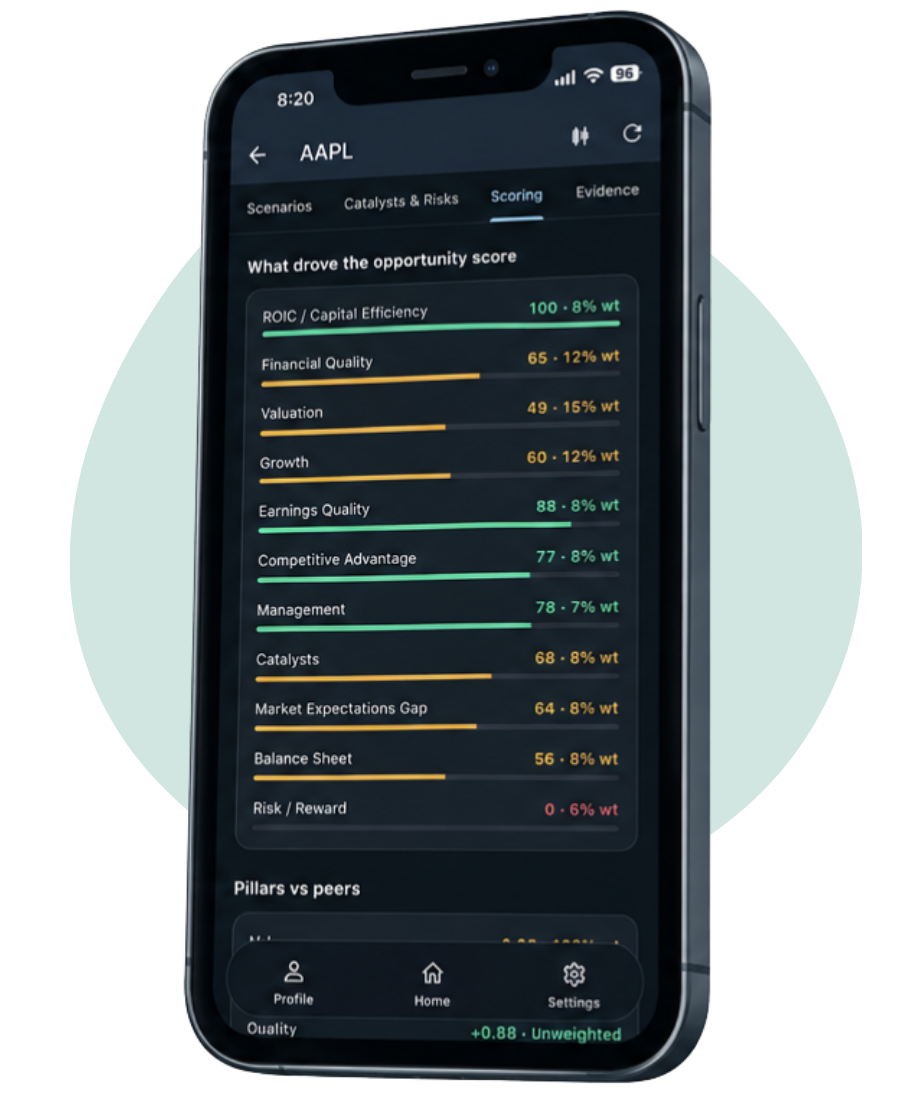
Peer Comparison & Scoring
Examine how a business compares with relevant companies and explore the factors behind its analytical score.
Create a free account and get 10 free daily stock searches, with no subscription fees.
Explore Evolty Stock
Visit evolty.net to learn more and download the app for iOS or Android.
Evolty provides informational research, not personalized investment advice
Final Thoughts: Better Investing Starts With Better Questions
Evaluating a stock isn’t about finding one perfect financial ratio.
It’s about understanding the relationship between growth, profitability, cash generation, shareholder ownership, and the price investors are being asked to pay.
Revenue growth reveals how a business is expanding.
Operating margins show how effectively it converts sales into operating profit.
Free cash flow helps assess its ability to generate and allocate cash.
Shares outstanding reveal how changes in the ownership structure can affect value per share.
Together, these metrics provide a more complete picture of a company’s financial performance.
But their greatest value comes from using them to ask better questions, build realistic scenarios, and recognize when the evidence no longer supports the original investment thesis.
The goal isn’t to predict every market movement. It’s to understand the business well enough to evaluate what could happen next.
Disclaimer: This article is for educational and informational purposes only and does not constitute investment advice. Financial metrics, examples, and scenarios are illustrative and should be evaluated in the context of each company’s circumstances.
Listen to the Full Episode
Prefer to hear the discussion? 🎧 Listen to Episode 8 of The Wealth Journey, where we explore the 100-point stock analysis framework, walk through the Microsoft example, and examine the questions AI raises about competitive advantages.
Take your research further
Go deeper with Evolty.
A stock’s story goes beyond its headline price. Explore what drives a company’s performance, what the market expects, and what risks could change the picture.
Explore valuation, financial performance and growth expectations.
Compare peers, competitive advantages, risks and potential catalysts.
Bring multiple perspectives together before making your own investment decisions.
Start exploring stock research with Evolty.